2020 has been a very challenging year for everyone and it has required things to adapt and change as the ongoing human malware event continues to have an impact on us. I have been fortunately enough to continue working from home and have been able to further improve and expand on the Stats Page, Reports and Graphs sites. Some of the changes are behind the scenes updates and others are more visible.
Wait Wait in 2020
Due to the requirements of social distancing and limiting travel, Wait Wait… Don’t Tell Me! canceled live tapings of their show and went back to their roots of recording the show from remote (home) studios. Before the human malware event, I had actually planned to travel to Chicago to attend a live taping on my 40th birthday in April. Part of the plan also included giving me the opportunity to request the panel of my choice.
Even though that trip was canceled, the team at Wait Wait were able to get the panelists that I had chosen (Faith Salie, Luke Burbank and Mo Rocca) and there were two nice mentions during the show that aired on April 25th.
Stats Page and API Updates
I may not have gone to Chicago in April, but I did still take time off from work, used some of that time to listen to Wait Wait shows before 2006 and collect Bluff the Listener, Not My Job and Lightning Fill-in-the-Blank data to fill in any gaps that I had in the Stats Page database. The Bluff the Listener data that I collected would useful for a new feature that I’ll get to later.
Through the rest of the year, I made a couple of minor changes to the data access library that the Stats Page and the Stats API make use of to pull data from the database. Some of those include bug fixes due to missing date to string conversions and data formatting to make things more consistent. The Stats API also got a fix to correct a few mistakes that I made when copying code to handle requests.
The Stats Page got a couple of updates to the CSS to correct issues that the WAVE Web Accessibility Tool brought up when I started more thorough accessibility testing of the Stats Page and Graphs Site. Another accessibility change was to make the page breadcrumbs more usable on devices with smaller, touch-driven screens.
I’ve also added a couple of new features including:
- On This Day page that lists shows that aired in the past on the current month and day.
- Locations section that provides a list of show locations and changing the location text on each show to link to the corresponding location page.
- Adding (where data is available) Lightning Fill-in-the-Blank start and correct values for each show on the panelist pages. This also included changing how the panelists’ ranks are listed.
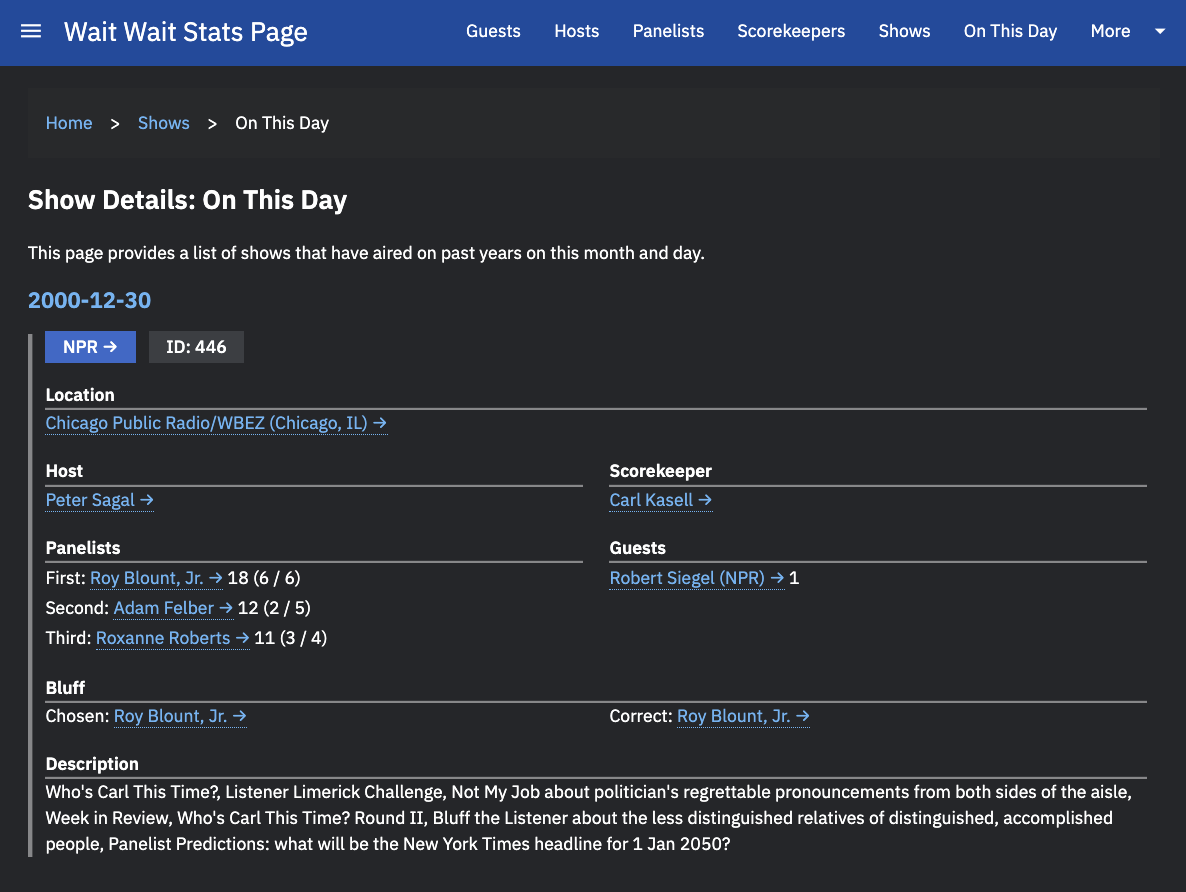
Updated Show Details 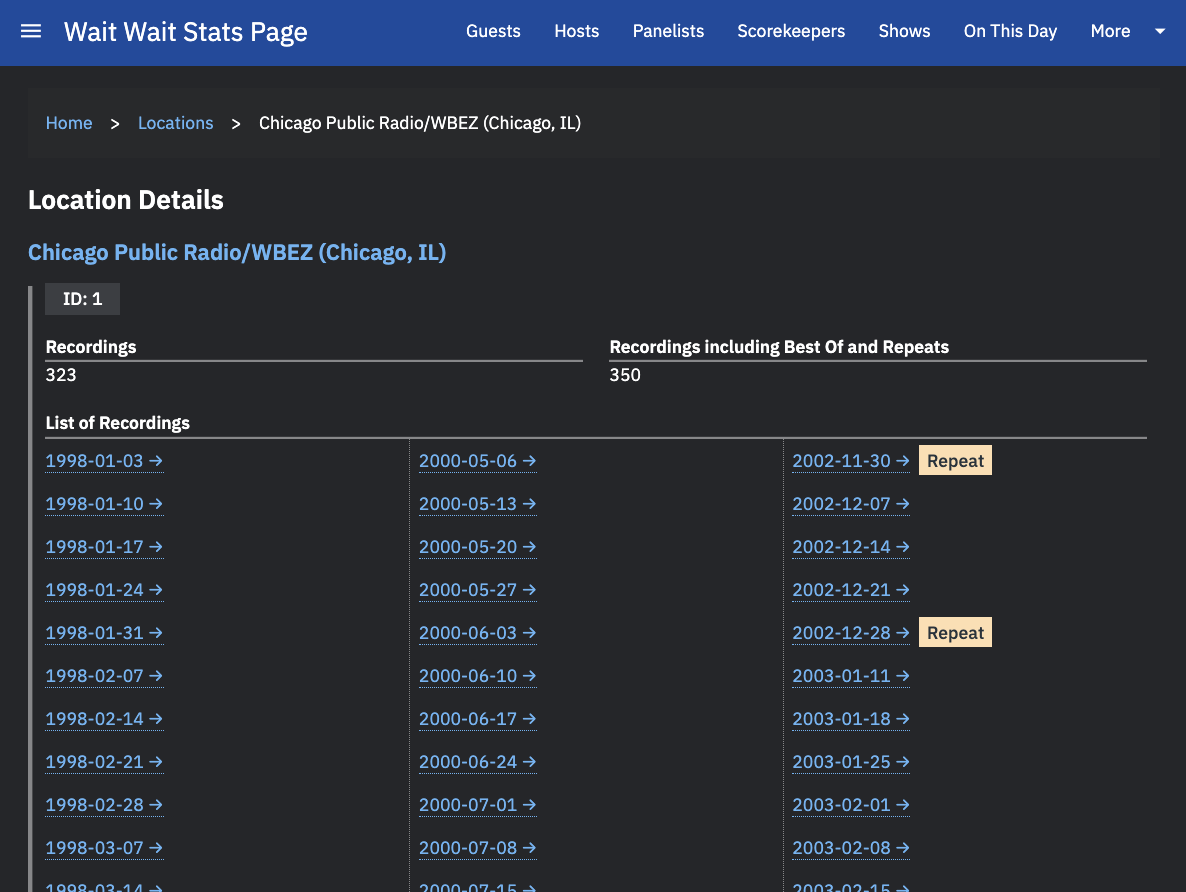
Show Location Details 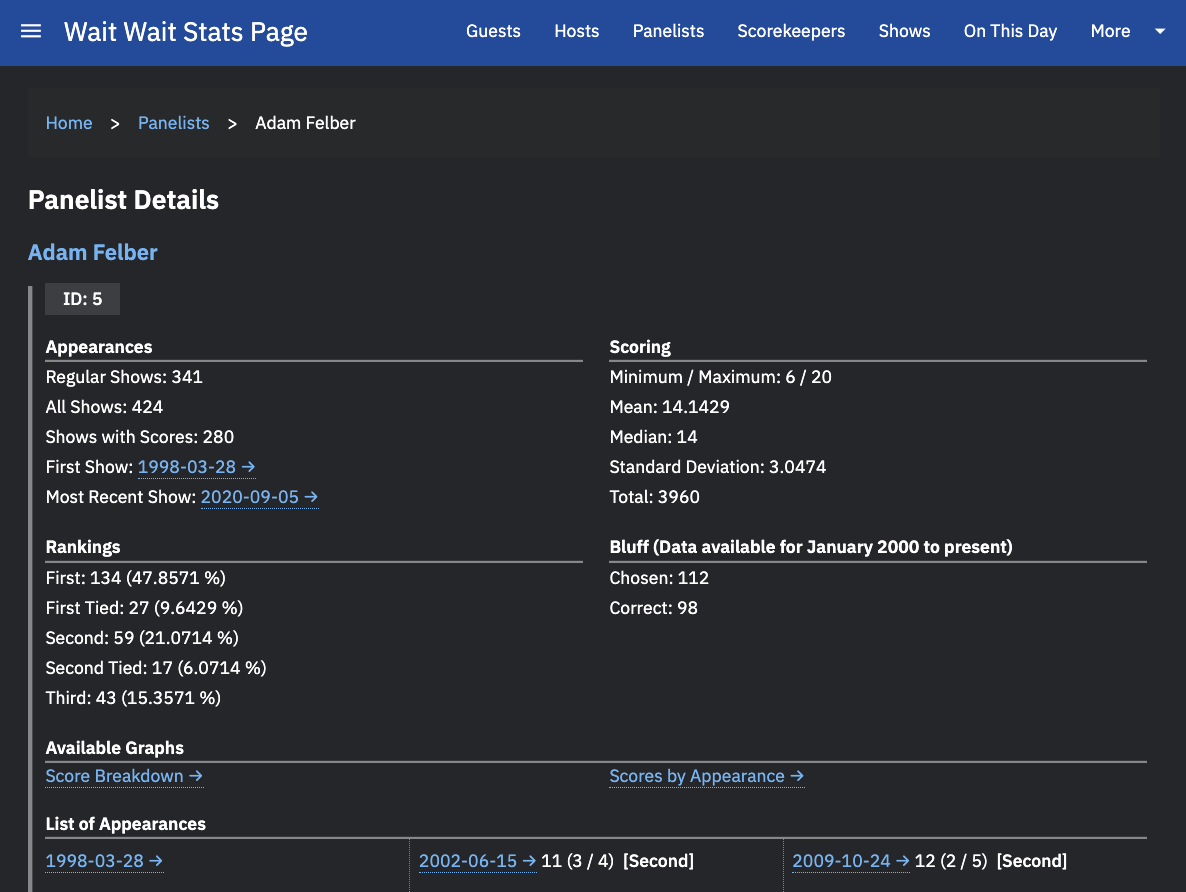
Updated Panelist Details
Reports Site
Over the past year, I have added a number of new reports to the Reports Site and restructured the landing page and created new section pages to improve site navigation. The new reports touch on statistics surrounding Bluff the Listener data, panelist and Not My Job guest appearances, and Lightning Fill-in-the-Blank scores.
One of new Reports Site features that I recently added was to include the ability to search for shows that had a panel consisting of one, two or three selected panelists. Another new feature includes the ability to look up how two panelists have fared against each other, including scoring information. This provides more granular information than the existing Panelist vs Panelist report.
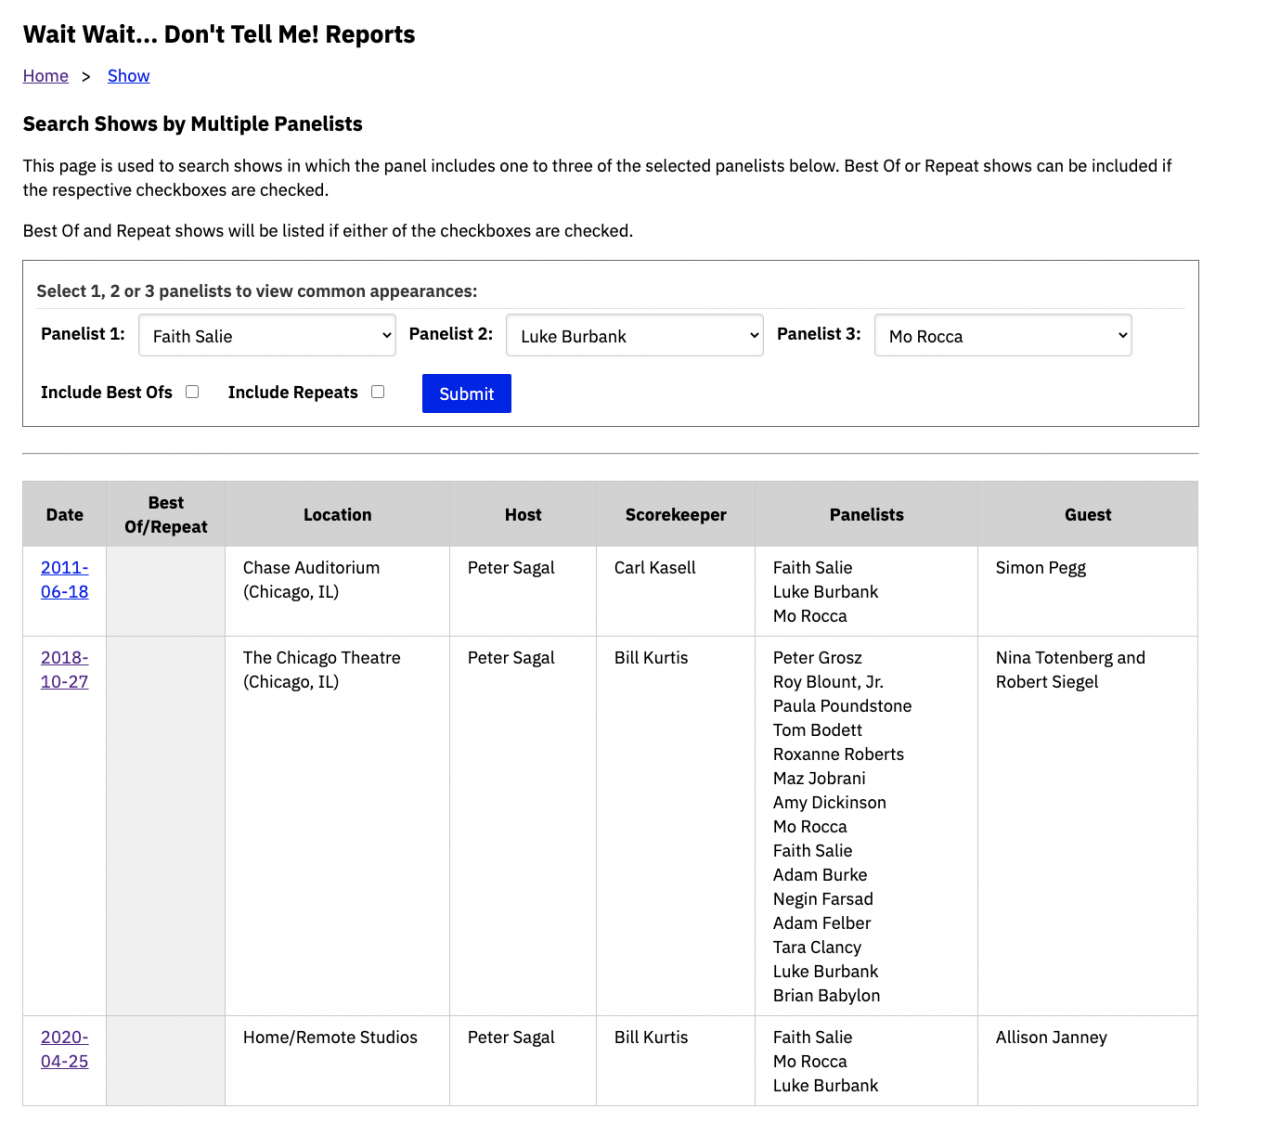
Search Shows by Multiple Panelists 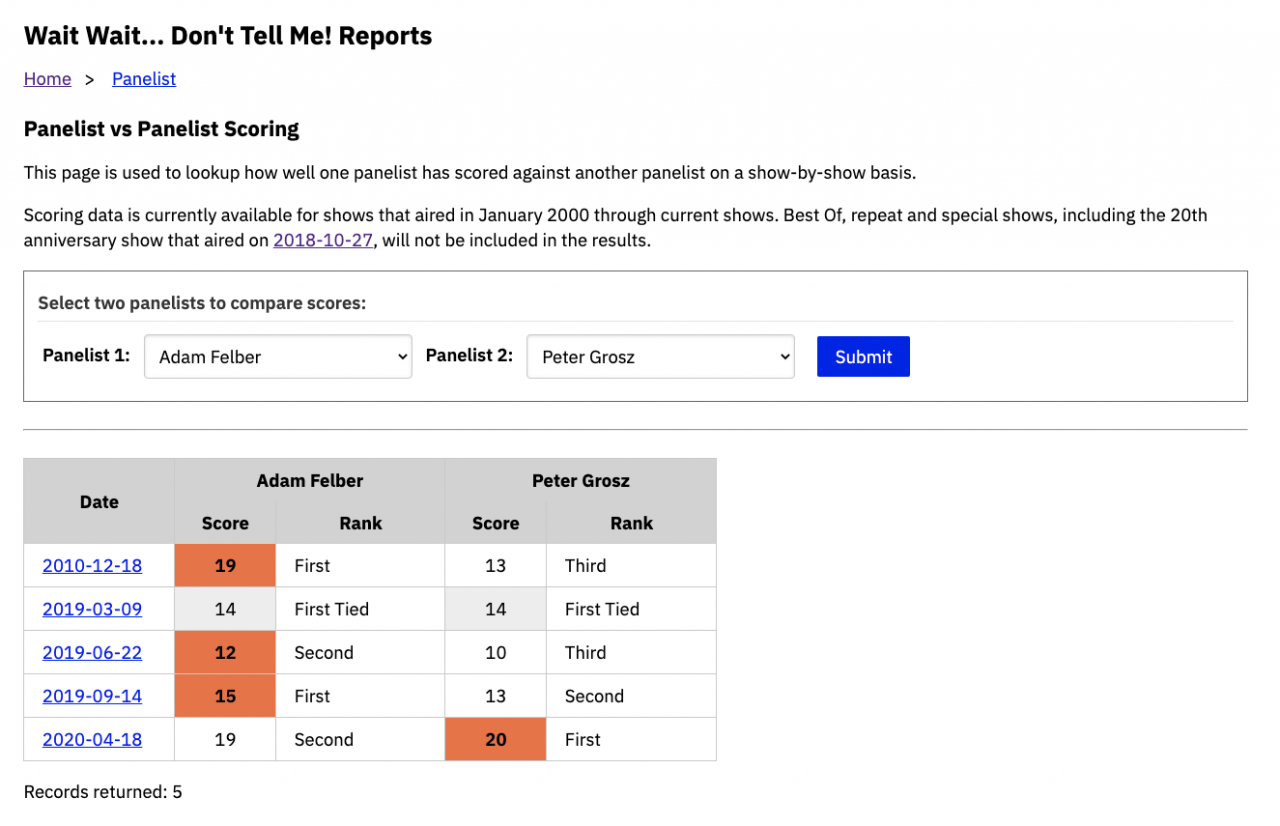
Panelist vs Panelist Scoring

Graphs Site
Not to be left out, the Graphs Site also got a couple of updates over the course of the year, both in terms of behind the scene code updates and in features. As with the Stats Page, the Graphs Site did get some accessibility updates that include updating the page breadcrumbs styling and CSS updates to resolve issues that the WAVE Web Accessibility Tool brought up.
Another update to the Graphs Site was to replace the Chart.js charting library, which had been updated throughout the year, with Plotly.js. I had originally chosen Chart.js for its simplicity and minimal code footprint; and, it has served its purpose quite well.
The developers of Chart.js announced that upgrading from version 2 to 3 would require breaking changes. That and the limited set of chart types kickstarted my decision to look for another charting library. Plotly was chosen for its extensive selection of chart types, having both a JavaScript library and a Python library, and more extensive customization options.
I had originally chosen Chart.js for its simplicity and minimal code footprint; and, it has served its purpose quite well. The breaking changes required to upgrade to version 3.0 in order to support future browser versions and the limited set of chart types made the decision to look for another charting library that much easier. Plotly was chosen for its extensive selection of chart types, having both a JavaScript library and a Python library, and more extensive customization options.
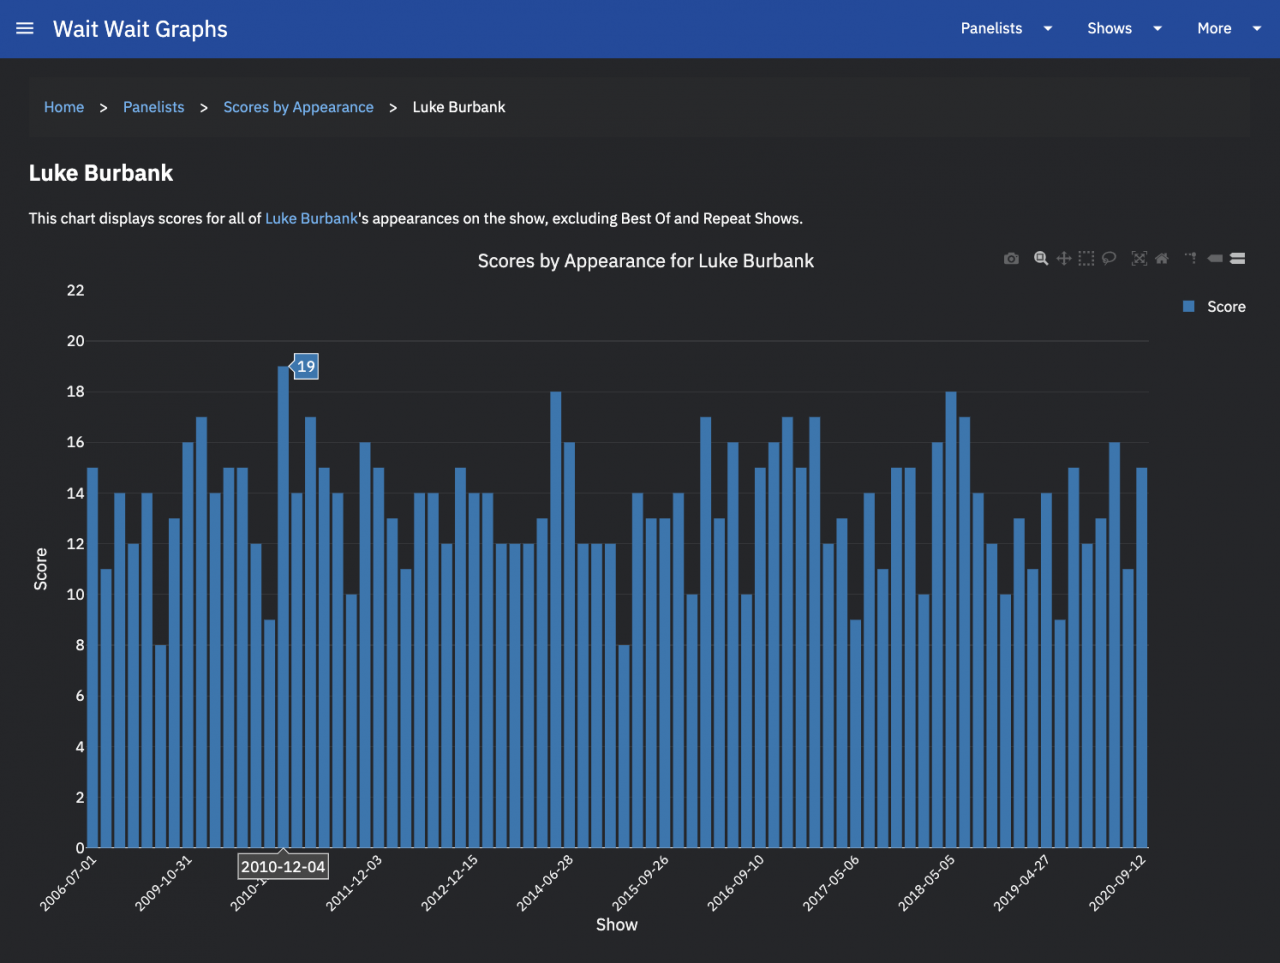
Scores by Appearances Graph using Plotly.js 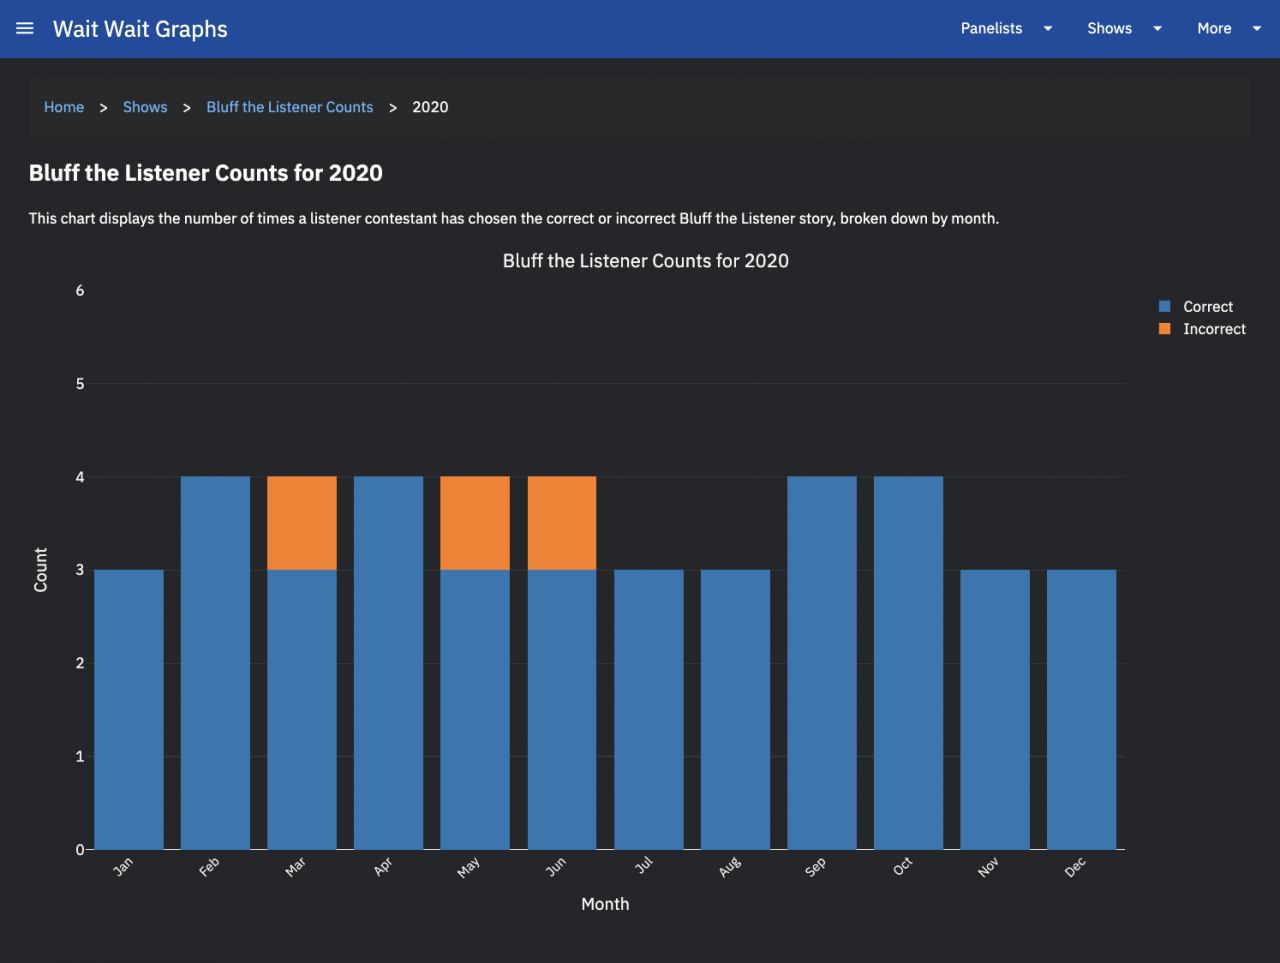
Bluff the Listener Counts Graph 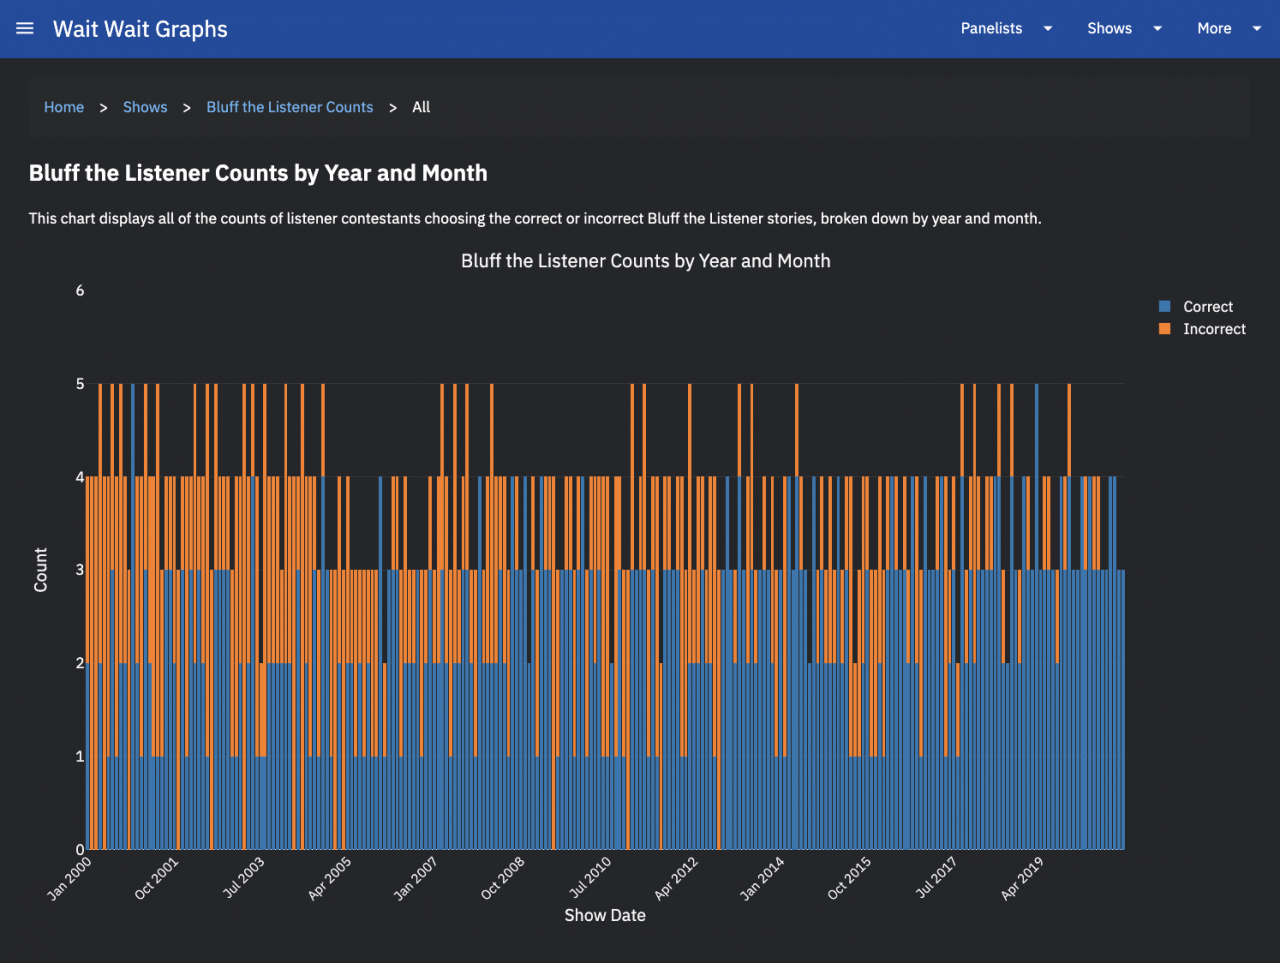
Bluff the Listener Counts for All Years Graph

The switch to Plotly also brings some performance improvements and adds the ability to select a portion of the graph to zoom into and pan along the x-axis for a more detailed look at the data. Plotly also provides the additional configuration options on exporting the chart, including customizing the export file name and the image dimensions when configuring each chart.
A fellow Wait Wait fan wanted to see how well the listener contestants have been doing at choosing the correct Bluff the Listener story over the years and would like to see that in plotted out. So, I went to work on creating a new set of graphs that plotted the (now more completed) Bluff data, grouped by month and another graph showing the data across all years.
What’s Next?
Although I haven’t formalized a full list of new features that I have planned for the sites in 2021, there are a couple of things that I plan on experimenting on now that I have switched the Graphs Site to use Plotly. There will always be new reports to be created based on requests for data or statistics that I get on a regular basis.
There is still a sliver of hope that audio from the lost years, 1998 and 1999, will be made available as NPR continues their digitization projects. That would provide a chance to fill in my data blanks for those years.
Here’s to hoping that 2021 will be a better year than 2020 has been.
Postscript
The source code for the Stats Page, Reports Site, Graphs Site and the Stats API are all published under the open source Apache License, Version 2.0 and are available on GitHub at github.com/questionlp.
I also dug up the code for versions 2 and 3 of the Stats Page and was able to get them working on more modern versions of Ubuntu and PHP. It did require a some changes to the code to bring them up to PHP 7 standards. While neither version are available publicly online, I have them running on virtual machines at home so that I can compare and reference them as needed. The updated source code for both are also released under the Apache License, Version 2.0 and are also available on GitHub.